Nikit Abhyankar

From LinkedIn

Original analyses, charts, and animations from Nikit Abhyankar’s LinkedIn posts, with complete text and links to the discussion.

Regional hydropower generation and national peak electricity demand in India, comparing 2024, 2025, and 2026.
Original chart · open image to enlarge

El Niño and India’s grid vulnerability

El Niño is exposing a critical vulnerability in the Indian power grid. 40 GW higher peak demand. 13 GW less hydropower during peak.

Read the original postClose original post
El Niño is exposing a critical vulnerability in the Indian power grid.
40 GW higher peak demand. 13 GW less hydropower during peak.

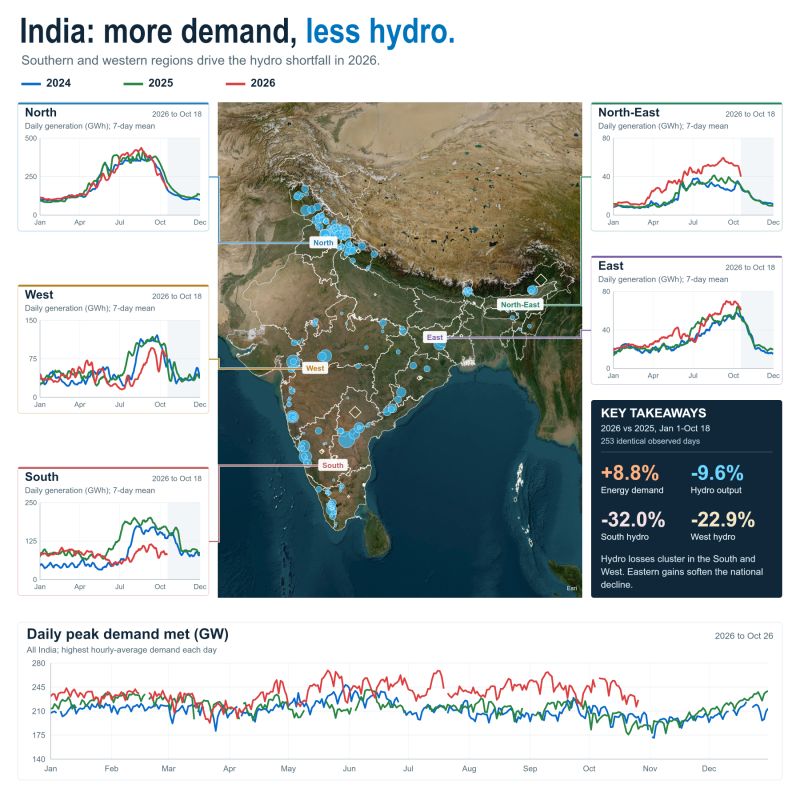
The chart shows daily hydro electricity generation across every hydro plant in India, 2024–2026, alongside national peak demand. Red = 2026, Green = 2025, Blue = 2024.

During July–September 2026, India's peak electricity demand reached 270 GW, which is ~40 GW higher than a year earlier. At the same time, hydropower generation during peak demand hours fell by 13 GW. Total hydro energy generation has fallen by ~20%, relative to 2025.

The result? Severe pressure on the grid and widespread power shortages.

But the El Nino hydropower impact is very different regionally.
Southern India: Hydro generation fell sharply during the monsoon months.
Western India: Generation has been significantly weaker during several critical periods.
North-East and East: Surprisingly, hydropower generation has actually been higher than in previous years during much of 2026.
Northern India: Generation has been relatively resilient.

This is why national averages can be so misleading.
El Niño exposes a potentially dangerous double vulnerability: hotter weather drives electricity demand higher, while weaker rainfall and reservoir inflows constrain hydro - one of the grid's most valuable sources of flexible generation.

==> We need to fundamentally rethink how we assess weather-related risks in electricity planning.

Explore daily electricity generation and costs for power plants across India:
https://lnkd.in/gj_Xt6SD
Amol Phadke Mohit Bhargava Umed Paliwal Paritosh Jaiswal India Energy & Climate Center (IECC) Ministry of New and Renewable Energy (MNRE) Soonee Sushil Kumar Narasimhan S.R. Ashwin Gambhir Ministry of Power Govt of India Neelima Jain Shruti Mahajan Deorah
#waterstress #india #grid #hydropower #elnino
View post & discussion on LinkedIn ↗
Original animation · plays automatically, muted

India’s electricity, one power plant at a time

How does India actually generate its electricity? ⚡ Let us analyze one power plant at a time? Every generating unit. Every day. For the last 3 years.

Read the original postClose original post
How does India actually generate its electricity? ⚡
Let us analyze one power plant at a time? Every generating unit. Every day. For the last 3 years.

🔗Check out the dashboard with downloadable data here: https://lnkd.in/gj_Xt6SD
(regularly updated)

We've collated an extensive database of daily electricity generation across India - coal, gas, solar, wind, hydro, nuclear, and bioenergy - covering 2024, 2025, and 2026 (through October 18), along with plant-level generation costs and electricity market prices.

And some fascinating patterns emerge:

🔹 Solar is booming. But coal generation is rising too. In 2026, solar generation increased 39% compared with the last year. Yet coal generation also increased ~8%. Existing thermal assets are crucial for maintaining the system reliability.

🔹 The geographical split between the solar / wind belt (west and south) and the coal belt (east and north) is clearly visible on the map.

🔹 Seasonality, really? Notice how flat the total national generation is across the year. But individual technologies and plants tell a very different story. Hydro and wind generation show enormous seasonal variations, with much of their output concentrated during the monsoon. The day-to-day variability in certain wind plants is very high - but together as a fleet is remarkably smooth within monsoon.

🔹 The El-Nino effect. During June–October, typically when hydropower generation peaks - it fell by 16% in 2026, with the entire shortfall made up by thermal generation.

🔹 Capacity scarcity in 2026 is visible in the split between market prices and generation costs. Demand increase in 2026 is clearly visible in increased thermal generation in September / October and consistent market price peaks during non-solar hours. In September, non-solar-hour electricity market prices surged 71% year-on-year, while the generation-weighted thermal variable-cost proxy increased just 4.4%.

This collated database and an interactive dashboard is now publicly available. You can examine individual plants, compare technologies and states, follow daily generation patterns, and explore electricity prices and costs.
🔗 Explore the dashboard: https://lnkd.in/gj_Xt6SD

A big shout out to Central Electricity Authority (Cea) GHANSHYAM PRASAD & Ministry of Power Govt of India for making the underlying data available in the public domain.

What patterns do you see? What else would you like to investigate using this data?

Amol Phadke Mohit Bhargava Paritosh Jaiswal Umed Paliwal Narasimhan S.R. Ashwin Gambhir Soonee Sushil Kumar
Ministry of New and Renewable Energy (MNRE) NITI Aayog Official
India Energy & Climate Center (IECC)
#India #Electricity #EnergyTransition #PowerMarkets
View post & discussion on LinkedIn ↗
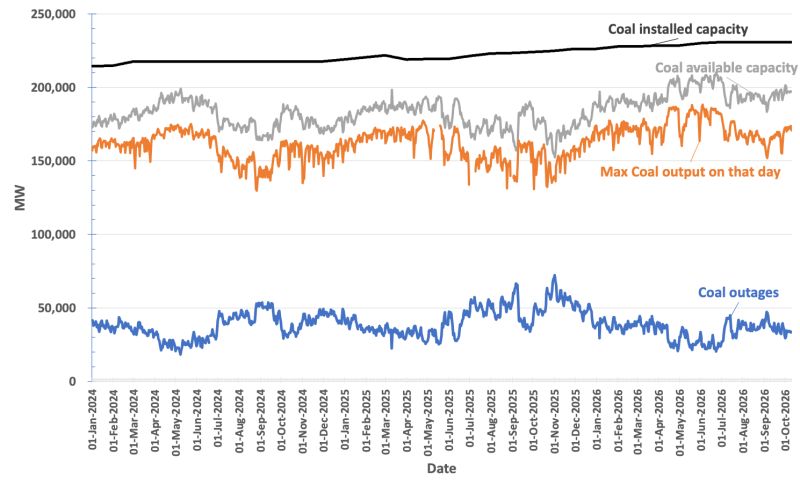
Installed coal capacity, outages, and actual output in India over nearly three years.
Original chart · open image to enlarge

Where is India’s missing 50 GW of coal power?

Where is India's missing 50 GW of coal power? India is facing a serious power crunch. Electricity markets are screaming about peak-power shortages. Even in October, states like Tamil Nadu are reportedly buying emergency power at prices as high as ₹37/kWh (~$380/MWh). Yes, ₹37 per unit!

Read the original postClose original post
Where is India's missing 50 GW of coal power?

India is facing a serious power crunch. Electricity markets are screaming about peak-power shortages. Even in October, states like Tamil Nadu are reportedly buying emergency power at prices as high as ₹37/kWh (~$380/MWh). Yes, ₹37 per unit!

And the peak-demand season of April–May is still ahead.

On paper, India has ~230 GW coal, 20 GW gas, 9 GW nuclear, and ~50 GW hydro capacity, against a non-solar-hour peak demand of ~250 GW. Shouldn't that be manageable?

Lets start with coal.

The chart below tells a striking story. Despite having ~230 GW of installed coal capacity (including lignite), India's maximum actual coal output rarely exceeds 180GW, even during periods of high demand.

Where is the missing ~50 GW?
* 20–40 GW (>10%) of coal capacity is out of service even on peak-demand days, due to planned maintenance or forced outages.
* Coal plants also consume roughly 8–10% (~20 GW) of their own generation for auxiliary operations, reducing the electricity delivered to the grid.

The result? Maximum observed coal output is only about 75–80% of installed capacity, even during high-demand periods. It never exceeds 180 GW.

And this is not a one-off problem.
The chart shows a remarkably persistent pattern over nearly three years. 230 GW of installed coal is NOT the same as 230 GW of dependable power.

With demand continuing to grow and the much higher-demand April–May season still ahead, India urgently needs more dependable, dispatchable capacity.

Battery storage offers perhaps the fastest near-term solution. Batteries can be deployed within months where grid connections are available, absorb inexpensive solar electricity during the day, and deliver power during critical evening and nighttime peaks. India cannot afford to wait years for new coal capacity to address shortages that could emerge within months.

Ultimately, reliability should be measured not by how many megawatts we have installed, but by how many megawatts can actually deliver when we need them most.

What should India prioritize before next summer: improving coal availability, accelerating battery deployment, or making peak demand more flexible?

#IndiaEnergy #GridReliability #EnergyStorage #PowerMarkets #IndiaEnergy #GridReliability #EnergyStorage #PowerMarkets
Amol Phadke Narasimhan S.R. Rahul Tongia Ajay Shah Soonee Sushil Kumar Ashwin Gambhir Alexander Hogeveen Rutter
Ministry of New and Renewable Energy (MNRE) Ministry of Power Govt of India
View post & discussion on LinkedIn ↗

Previous LinkedIn posts 17 posts

Original animation · plays automatically, muted

The dance of electricity demand and supply

⚡ The dance of India’s electricity demand and supply curves. This animation shows the aggregate IEX demand curve in green and supply curve in red in the Day Ahead Market (DAM), from June 2025 to June 2026. The yellow marker shows the market-clearing equilibrium price and quantity.

Read the original postClose original post
⚡ The dance of India’s electricity demand and supply curves.

This animation shows the aggregate IEX demand curve in green and supply curve in red in the Day Ahead Market (DAM), from June 2025 to June 2026. The yellow marker shows the market-clearing equilibrium price and quantity.

🕐 The charts show two moments in the day:
1 PM: typically a period of system oversupply due to solar
7 PM: the typical net load peak, when the system is most stressed

🔄 In the afternoon, supply volume is deep and the demand curve is relatively small. The market clears at modest prices, reflecting abundant energy in the system.

⚡By evening, the picture changes completely. Supply becomes much thinner, demand is higher, and prices routinely hit the DAM cap of Rs 10/kWh ($100/MWh). The system is effectively saying: flexibility, ramping capability, storage, and dispatchable capacity are valuable.

💡 Two takeaways:
1️⃣ India’s power market is still small relative to total system demand. The market-clearing quantity is often only around 5-10 GW, roughly 5-6% of total electricity demand.

2️⃣ But even at that scale, the market is speaking. Prices are moving making Scarcity and Surplus are visible.

📈 Seeing this dance of demand, supply, and price in motion is pretty amazing.

#IndiaPowerMarket #ElectricityMarkets #EnergyTransition #PowerSystems #IEX #RenewableEnergy #EnergyStorage #GridFlexibility
Soonee Sushil Kumar Narasimhan S.R. Samir Chandra Saxena Vivek Pandey Rajesh K Mediratta IEX India Indian Energy Exchange (IEX) Grid Controller of India Limited Sushanta Chatterjee Ashwin Gambhir Abhijit Abhyankar Disha Agarwal Shalu Agrawal Renuka Sane
Amol Phadke Umed Paliwal Paritosh Jaiswal Mohit Bhargava Dipesh Pherwani Neelima Jain Shruti Mahajan Deorah
View post & discussion on LinkedIn ↗
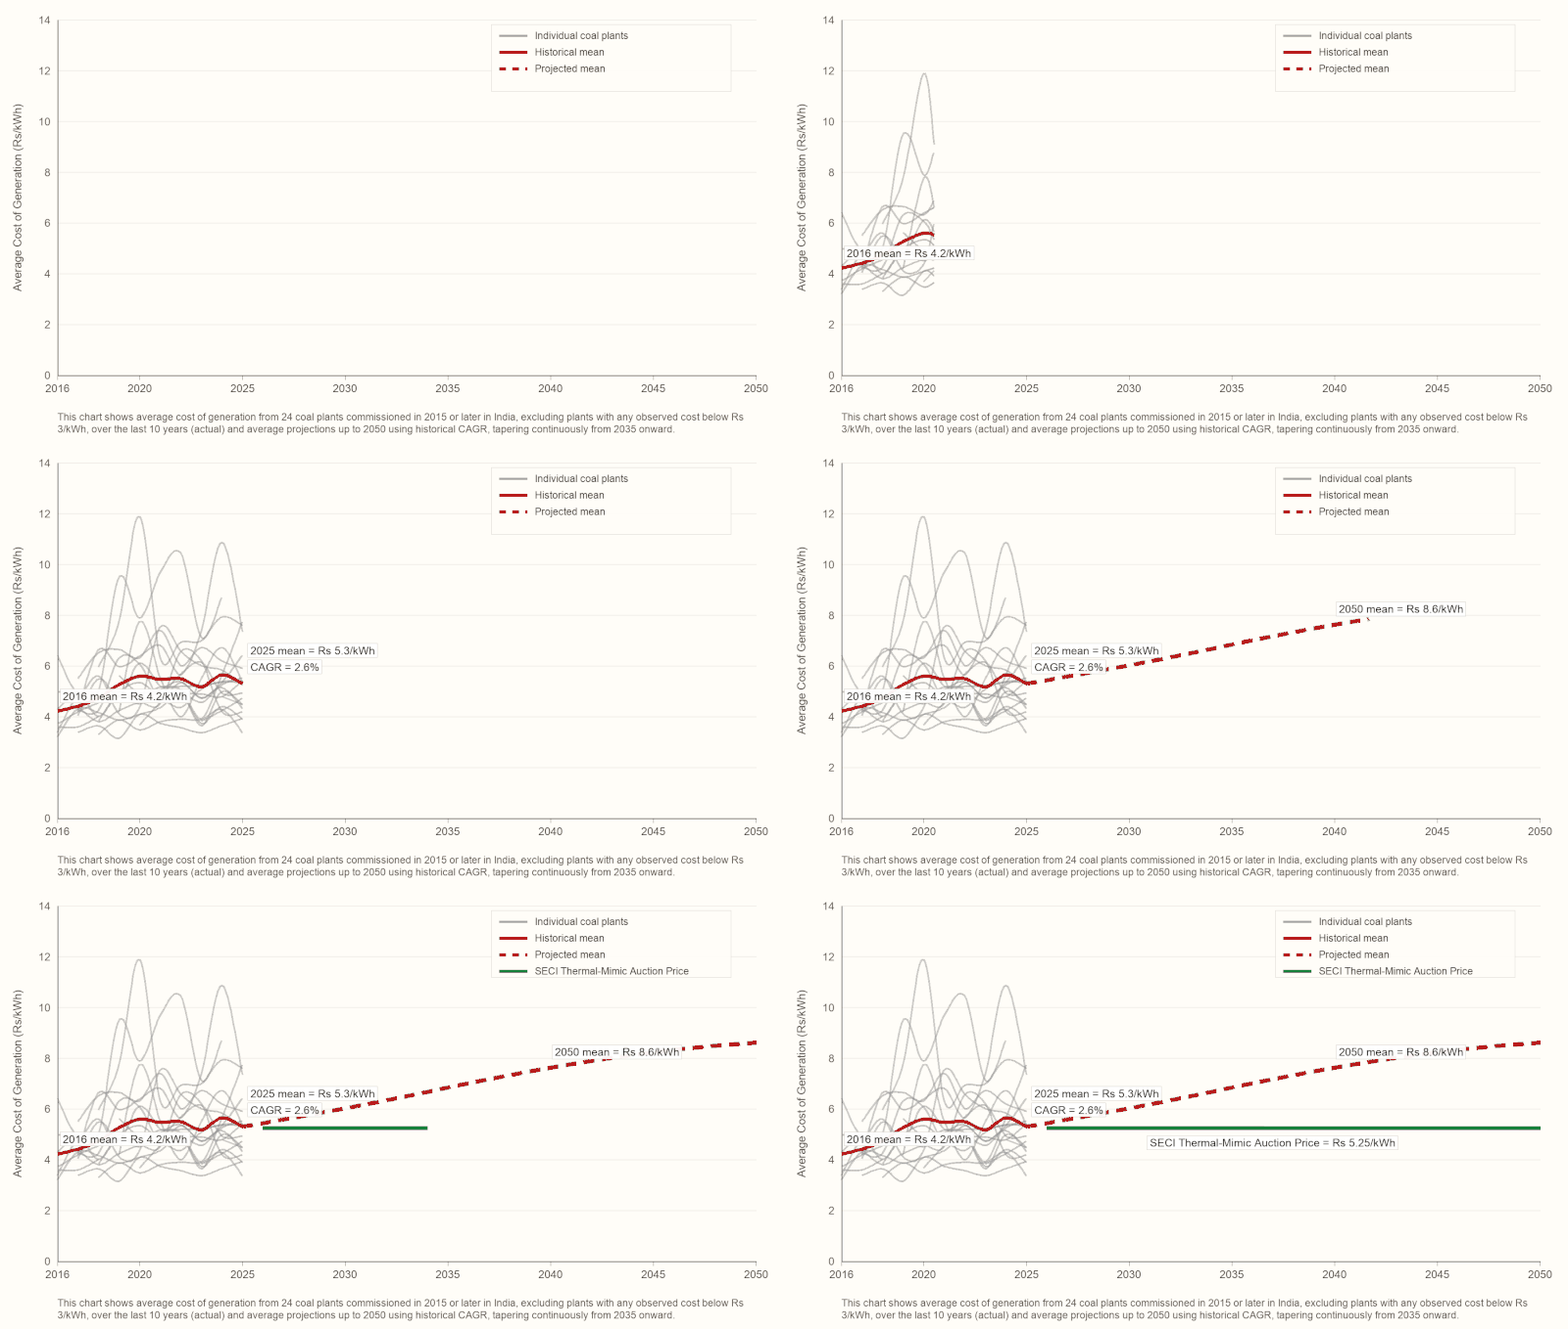
Historical and projected new-coal generation costs compared with a fixed renewable power tariff.
Original chart · open image to enlarge

Firm clean power at a fixed price

India's Power Sector Game Changer has Arrived!! "Thermal-mimic" FDRE RTC (firm and dispatchable renewable energy, round-the-clock) power is now available in India at Rs 5.25/kWh ($55/MWh) - flat for 25 years!!

Read the original postClose original post
India's Power Sector Game Changer has Arrived!!

"Thermal-mimic" FDRE RTC (firm and dispatchable renewable energy, round-the-clock) power is now available in India at Rs 5.25/kWh ($55/MWh) - flat for 25 years!!

Solar Energy Corporation of India Limited's FDRE RTC results were just announced.

Key specifications: 90% during peak hours, 50% during solar-hours, and 70% during non-peak, non-solar hours - every single day, enforced at every 15-minute interval. Exactly how a thermal plant would operate.

This is a big deal for two reasons:
1. Incredibly competitive price - among the lowest in the world.
2. But the more interesting part is that the price is flat and inflation-proof!

The chart shows *actual* average generation cost for every new coal plant commissioned in India since 2015 — about 39 GW. That fleet's average cost has gone from roughly Rs 4.2/kWh ($45/MWh) in 2016 to Rs 5.3/kWh ($56/MWh) in 2025, with some newer plants costing significantly above that number.

If that trend continues at even a tapering rate after 2035, new coal would average about Rs 8.6/kWh ($90/MWh) by 2050.

The green line is the Thermal-mimic clean power at Rs 5.25/kWh, and it doesn't move. Fixed in nominal Rupees for 25 years!!

That means clean firm power is already brushing up against coal prices, before accounting for fuel price volatility or carbon risk.

The question isn't whether clean power can be firm and competitive. It's both.

Amol Phadke Umed Paliwal Mohit Bhargava Paritosh Jaiswal Dipesh Pherwani Neelima Jain Shruti Mahajan Deorah Dr. Rahul Walawalkar Pratik Prasun Tarun Mukhija Sivakumar Vepakomma Rahul Tongia Ashwin Gambhir Ministry of New and Renewable Energy (MNRE)
#IndiaEnergy #PowerSector #Coal #RenewableEnergy #EnergyTransition #ElectricityMarkets #ClimateFinance
View post & discussion on LinkedIn ↗
May electricity demand and net-demand duck curves in India and California across multiple years.
Original chart · open image to enlarge

Two duck curves: India and California

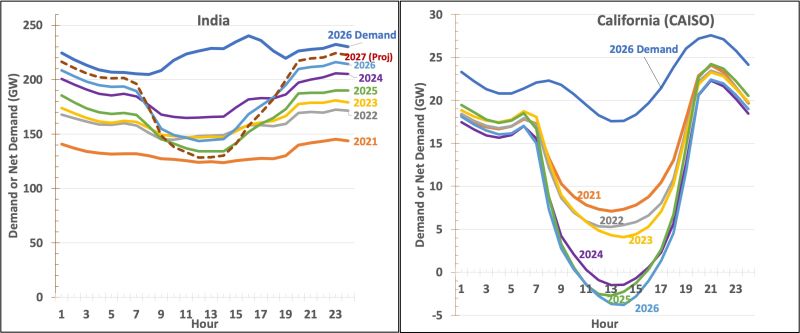
Not all duck curves are created equal. The chart shows duck curves for five years (2021 → 2026), same month (May), in California (CAISO) and India. With each passing year, the belly gets deeper and the neck gets longer.

Read the original postClose original post
Not all duck curves are created equal.

The chart shows duck curves for five years (2021 → 2026), same month (May), in California (CAISO) and India. With each passing year, the belly gets deeper and the neck gets longer.

Duck curves show net demand - which is demand minus variable RE (wind and solar) - so it represents what the conventional generators and energy storage need to meet. The chart also shows average hourly demand met in May.

California’s duck now goes negative — more solar than the system can use — then swings back up by roughly 24 GW into the evening peak. This ramp is increasingly met by batteries: California crossed 17 GW of storage this year, charging through the belly and discharging into the neck.

India’s duck looks similar in shape — net demand sagging toward ~130 GW at midday, climbing back to 230-240 GW after sunset. Bulk of that down-ramp and up-ramp is absorbed by thermal generation: coal backing down at noon, then cycling hard at dusk.
India has now become energy sufficient across the day, but increasingly peak deficient.

India’s duck curve is no longer a future—it’s already here. And it is putting immense pressure on the thermal fleet.

Energy storage, demand flexibility, energy efficiency are now urgently essential—and there is much to learn from California.

The duck isn’t the problem. An inflexible grid is.

If you would like the data used for this analysis, please download from here: https://lnkd.in/gH7t_bTK
Amol Phadke Umed Paliwal Paritosh Jaiswal Jose L. Dominguez B. Mohit Bhargava Soonee Sushil Kumar Narasimhan S.R. Samir Chandra Saxena Vivek Pandey Rajiv Porwal Ashwin Gambhir Debmalya Sen Shashank Jewalikar Dr. Rahul Walawalkar Rahul Tongia Siva Gunda David Hochschild Leuwam Tesfai J. Andrew McAllister
Ministry of New and Renewable Energy (MNRE) India Energy & Climate Center (IECC) Ministry of Power Govt of India Central Electricity Regulatory Commission (CERC) California Energy Commission
View post & discussion on LinkedIn ↗
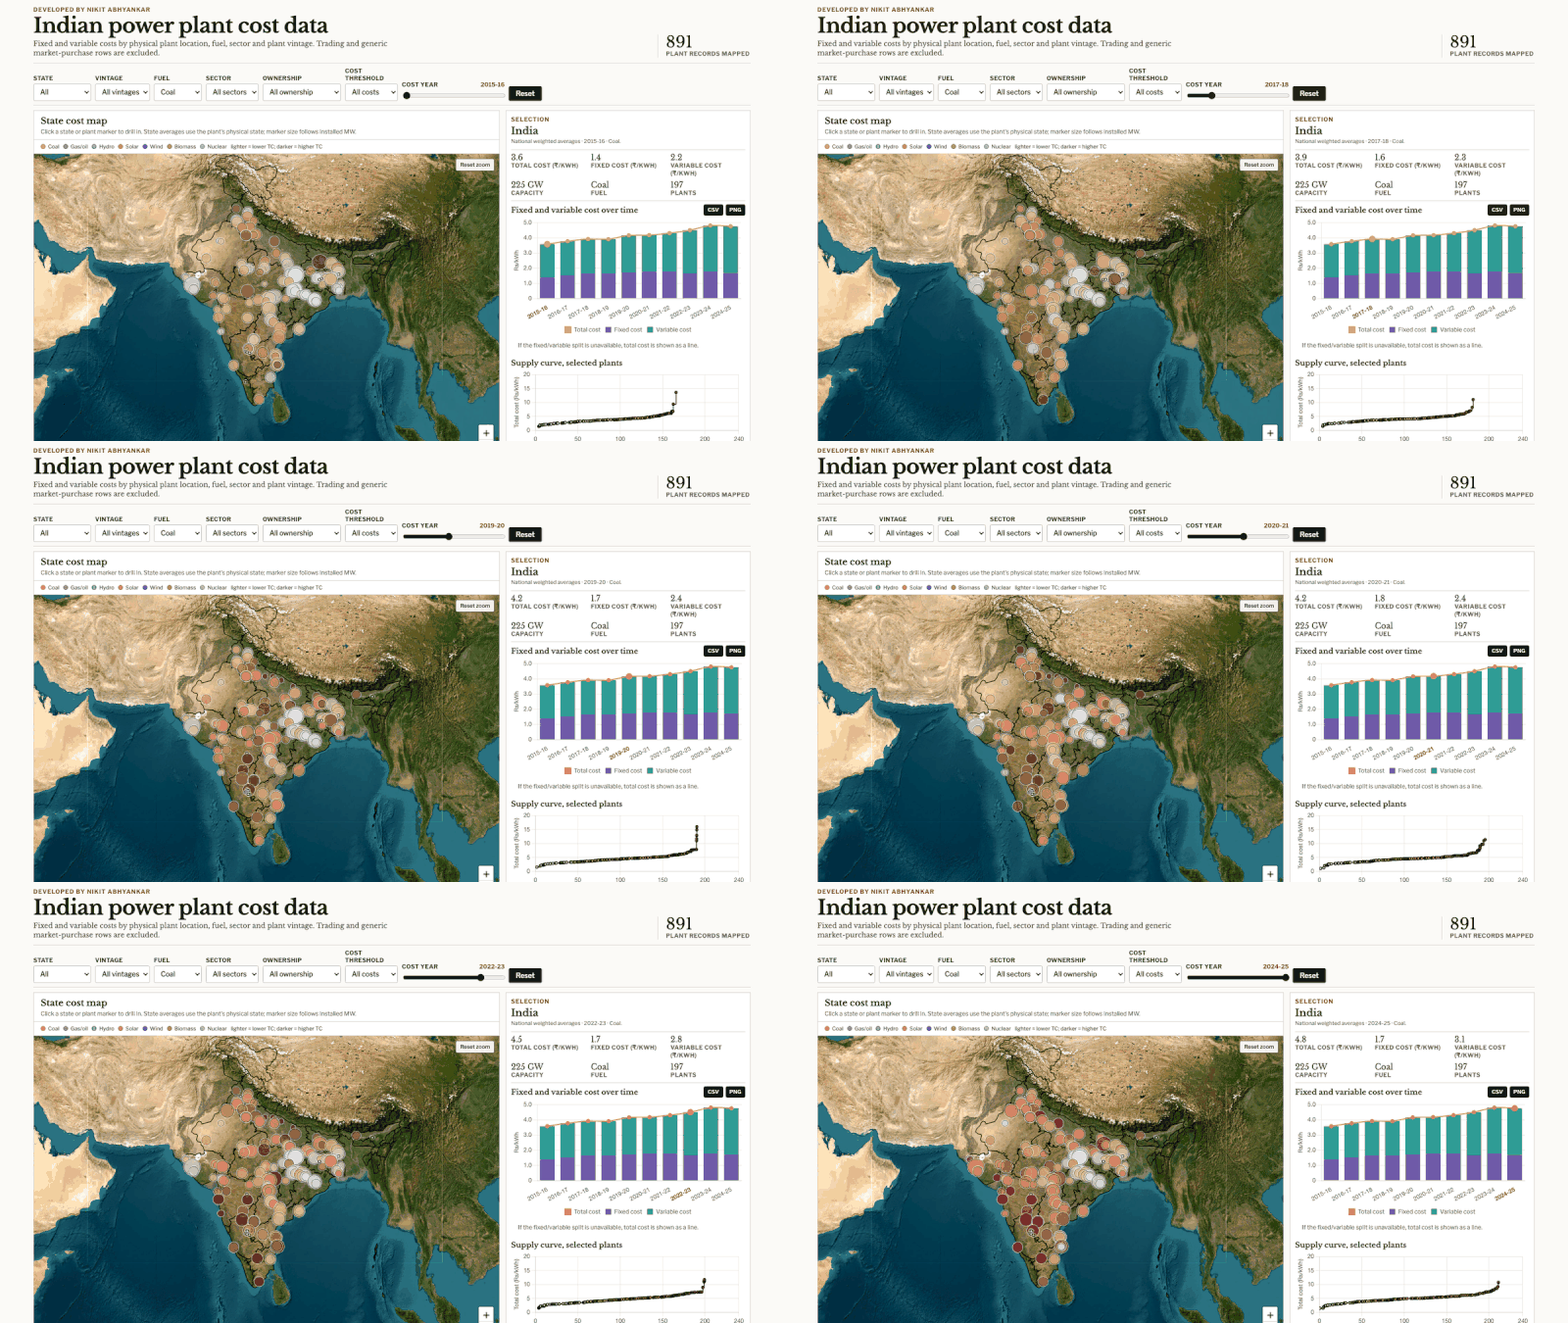
Dashboard of Indian power-plant generation costs by fuel, ownership, location, and year.
Original chart · open image to enlarge

The changing cost of electricity in India

What is the electricity generation cost in India and how has it changed over years? Here is a public dashboard. I pulled together a plant-level interactive dashboard of Indian power purchase costs: fixed cost, variable cost, total cost, fuel, state, ownership, and vintage.

Read the original postClose original post
What is the electricity generation cost in India and how has it changed over years? Here is a public dashboard.

I pulled together a plant-level interactive dashboard of Indian power purchase costs: fixed cost, variable cost, total cost, fuel, state, ownership, and vintage.

A few things jump out:

1. Thermal power is getting more expensive.
National weighted average coal cost (225 GW total) rose from ~3.6 Rs/kWh ($38/MWh) in 2015-16 to ~4.8 Rs/kWh ($50/MWh) in 2024-25.

2. The increase is mostly variable cost.
Since 2015-16, variable cost is up ~40%, while fixed cost is up ~22%. Since 2019-20, fixed cost is roughly flat, but variable cost keeps doing the damage.

3. The expensive tail is much larger.
About 44 GW of coal capacity has a total cost ≥6 Rs/kWh ($62/MWh) and 97 GW has a total cost of ≥5 Rs/kWh ($52/MWh).

4. Newer coal plants are actually more expensive
Thermal plants commissioned after 2015 (~36 GW) average ~5.5 Rs/kWh ($57/MWh), with higher fixed cost a big part of the story.

This matters because averages can hide the distribution.
So I built an interactive dashboard to make the plant-level picture easier to explore. It has costs for ALL technologies, including gas, hydro, nuclear, wind, biomass, and solar. 891 plants x 10 years split into fixed and variable costs.

You can go down all the way to individual power plant level and get a fully detailed picture.

Link to the dashboard in the first comment.
Also here:
https://lnkd.in/gpJC_Nxu
Built entirely using public data. Free to download.

Curious what others see in the data. Which plants, states, or cost patterns surprise you most?

#IndiaEnergy #PowerSector #Coal #Electricity #EnergyTransition
Amol Phadke Umed Paliwal Paritosh Jaiswal Mohit Bhargava Jose L. Dominguez B. Shruti Mahajan Deorah Neelima Jain India Energy & Climate Center (IECC) Ashwin Gambhir Soonee Sushil Kumar Rahul Tongia Narasimhan S.R. Alexander Hogeveen Rutter Erik Solheim NITI Aayog Official Ministry of New and Renewable Energy (MNRE) Ministry of Power Govt of India Central Electricity Regulatory Commission (CERC) Vasudha Foundation India Global Energy Monitor NTPC Limited PyPSA meets Earth Maximilian Parzen
View post & discussion on LinkedIn ↗
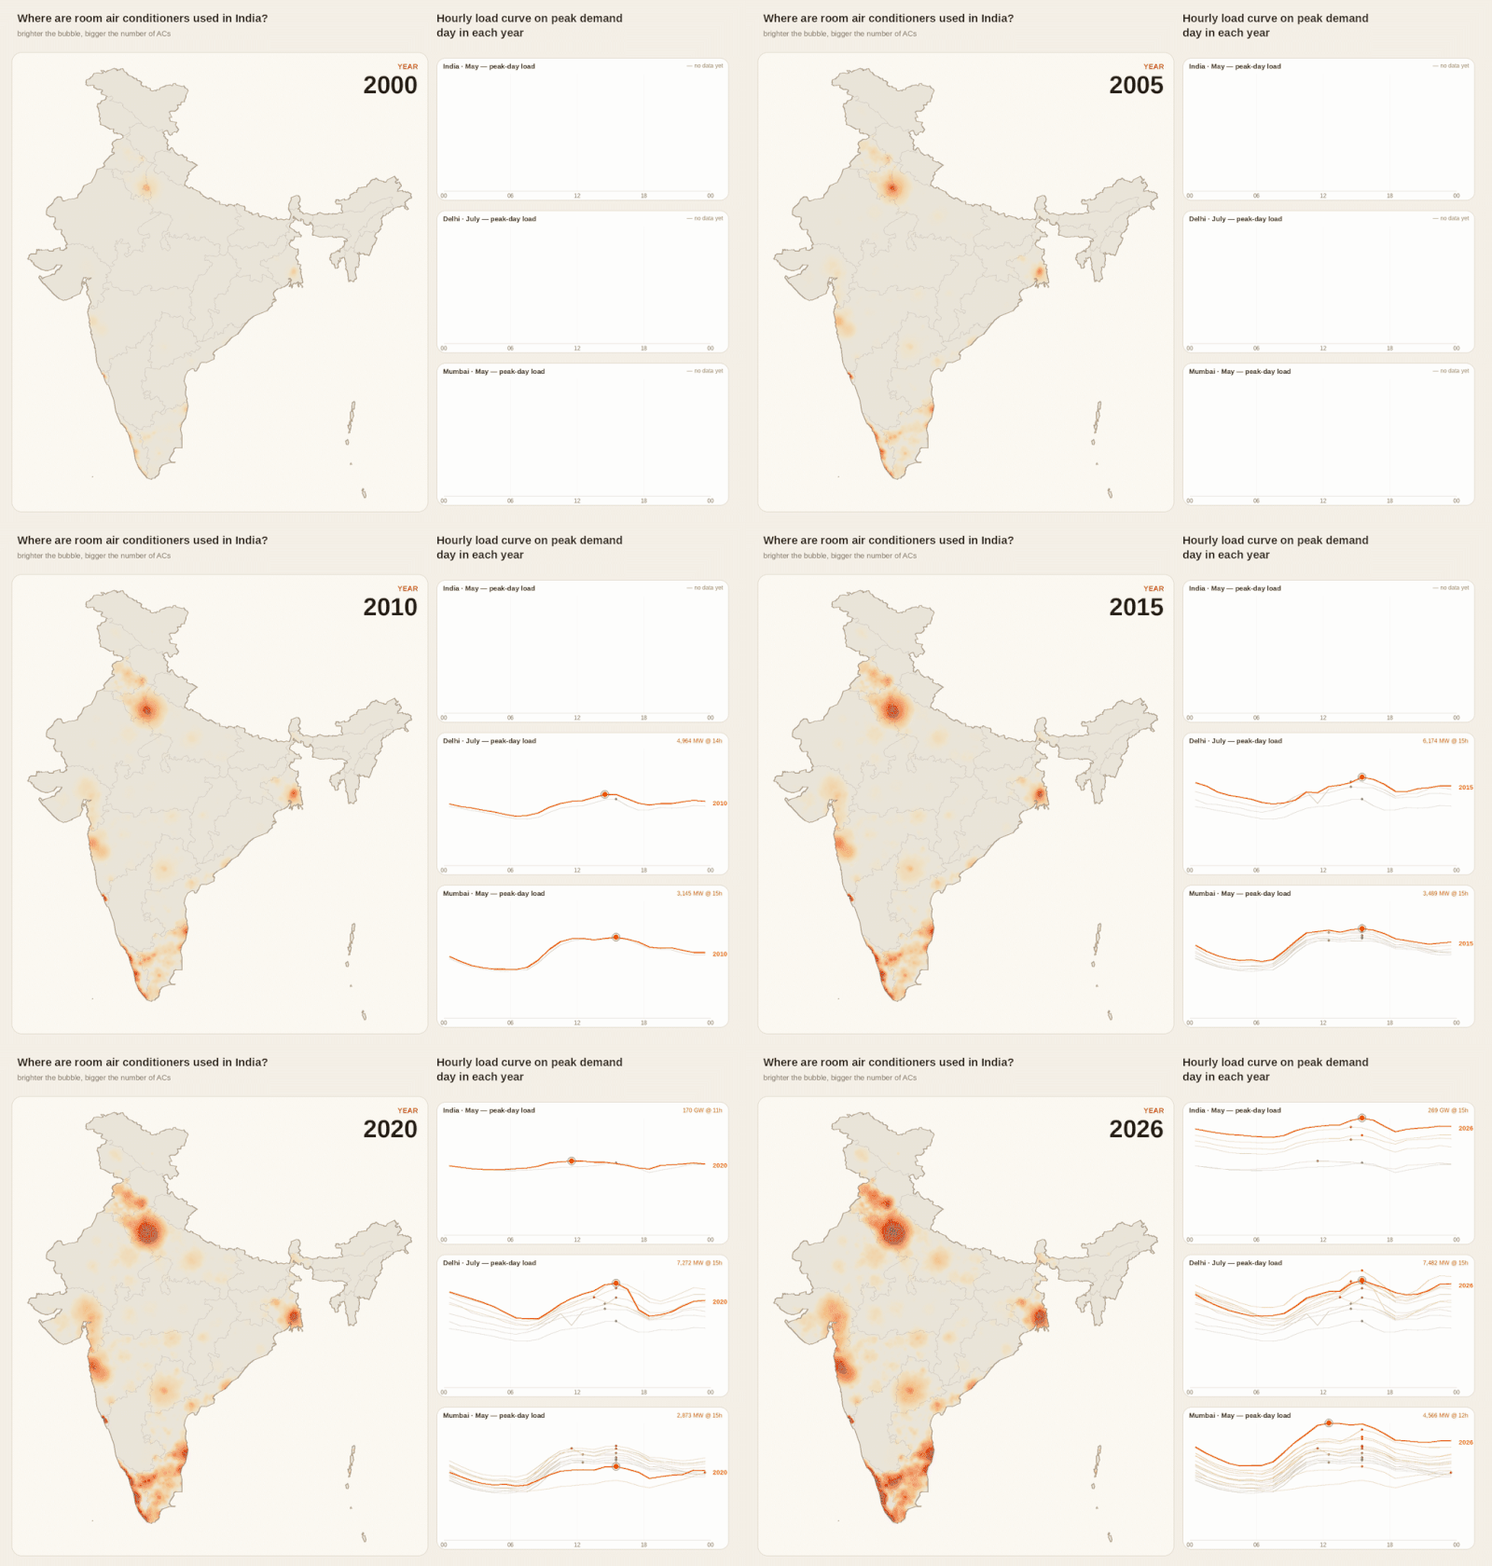
Room air conditioner adoption in Indian cities alongside electricity demand profiles.
Original chart · open image to enlarge

Cooling demand and the Indian grid

India’s grid met record-breaking peak demand (270 GW) in recent weeks. Room air conditioners were responsible for 60-70GW (~25%) of this peak demand !!!

Read the original postClose original post
India’s grid met record-breaking peak demand (270 GW) in recent weeks.
Room air conditioners were responsible for 60-70GW (~25%) of this peak demand !!!

ACs are power guzzlers.
A single room AC consumes 100-150 times as much power as an LED bulb.
And India is adding an estimated 10–15 million new ACs every year, and growing rapidly.

But how rapidly? And what does that mean for the grid?

The map on the left shows the estimated number of room ACs in use across key Indian cities.
The chart on the right shows electricity load on peak demand days across India, in Delhi, and in Mumbai over the last several years.

As AC penetration has increased, electricity demand has become peakier. More importantly, it has become more stubborn. Demand now stays high well into the night.

And yet, as the map shows, India is only at the beginning of its AC boom.

Over the next decade, ACs will contribute ~180 GW to peak demand. That’s higher than the entire peak demand of the country of Japan!!

We cannot treat this only as a supply-side problem. Building more generation capacity is important, but it is not enough. We also need to actively manage cooling demand.

That means better AC efficiency standards, demand response, thermal comfort strategies, building design improvements, and smarter cooling policies.

We explore these trends, their implications for the grid, and the role of AC efficiency standards in our new report:

https://lnkd.in/g73KTfW8
Amol Phadke Jose L. Dominguez B. Nihar Shah India Energy & Climate Center (IECC) Bureau of Energy Efficiency (ऊर्जा दक्षता ब्यूरो) Saurabh Kumar Dr. Ashok Sarkar, Ph.D. Neelima Jain Ajay Mathur Aarti Khosla Gunjan Jain Soumya Garnaik Dr. Satish Kumar Saurabh Diddi Paritosh Jaiswal Ankit Kalanki Aditya Chunekar Mehul Jain Neha Dhingra Mahesh Patankar Amit Khare
View post & discussion on LinkedIn ↗
World map and timeline of power plant additions by technology from 1975 to 2025.
Original animation · open image to enlarge

Fifty years of global power

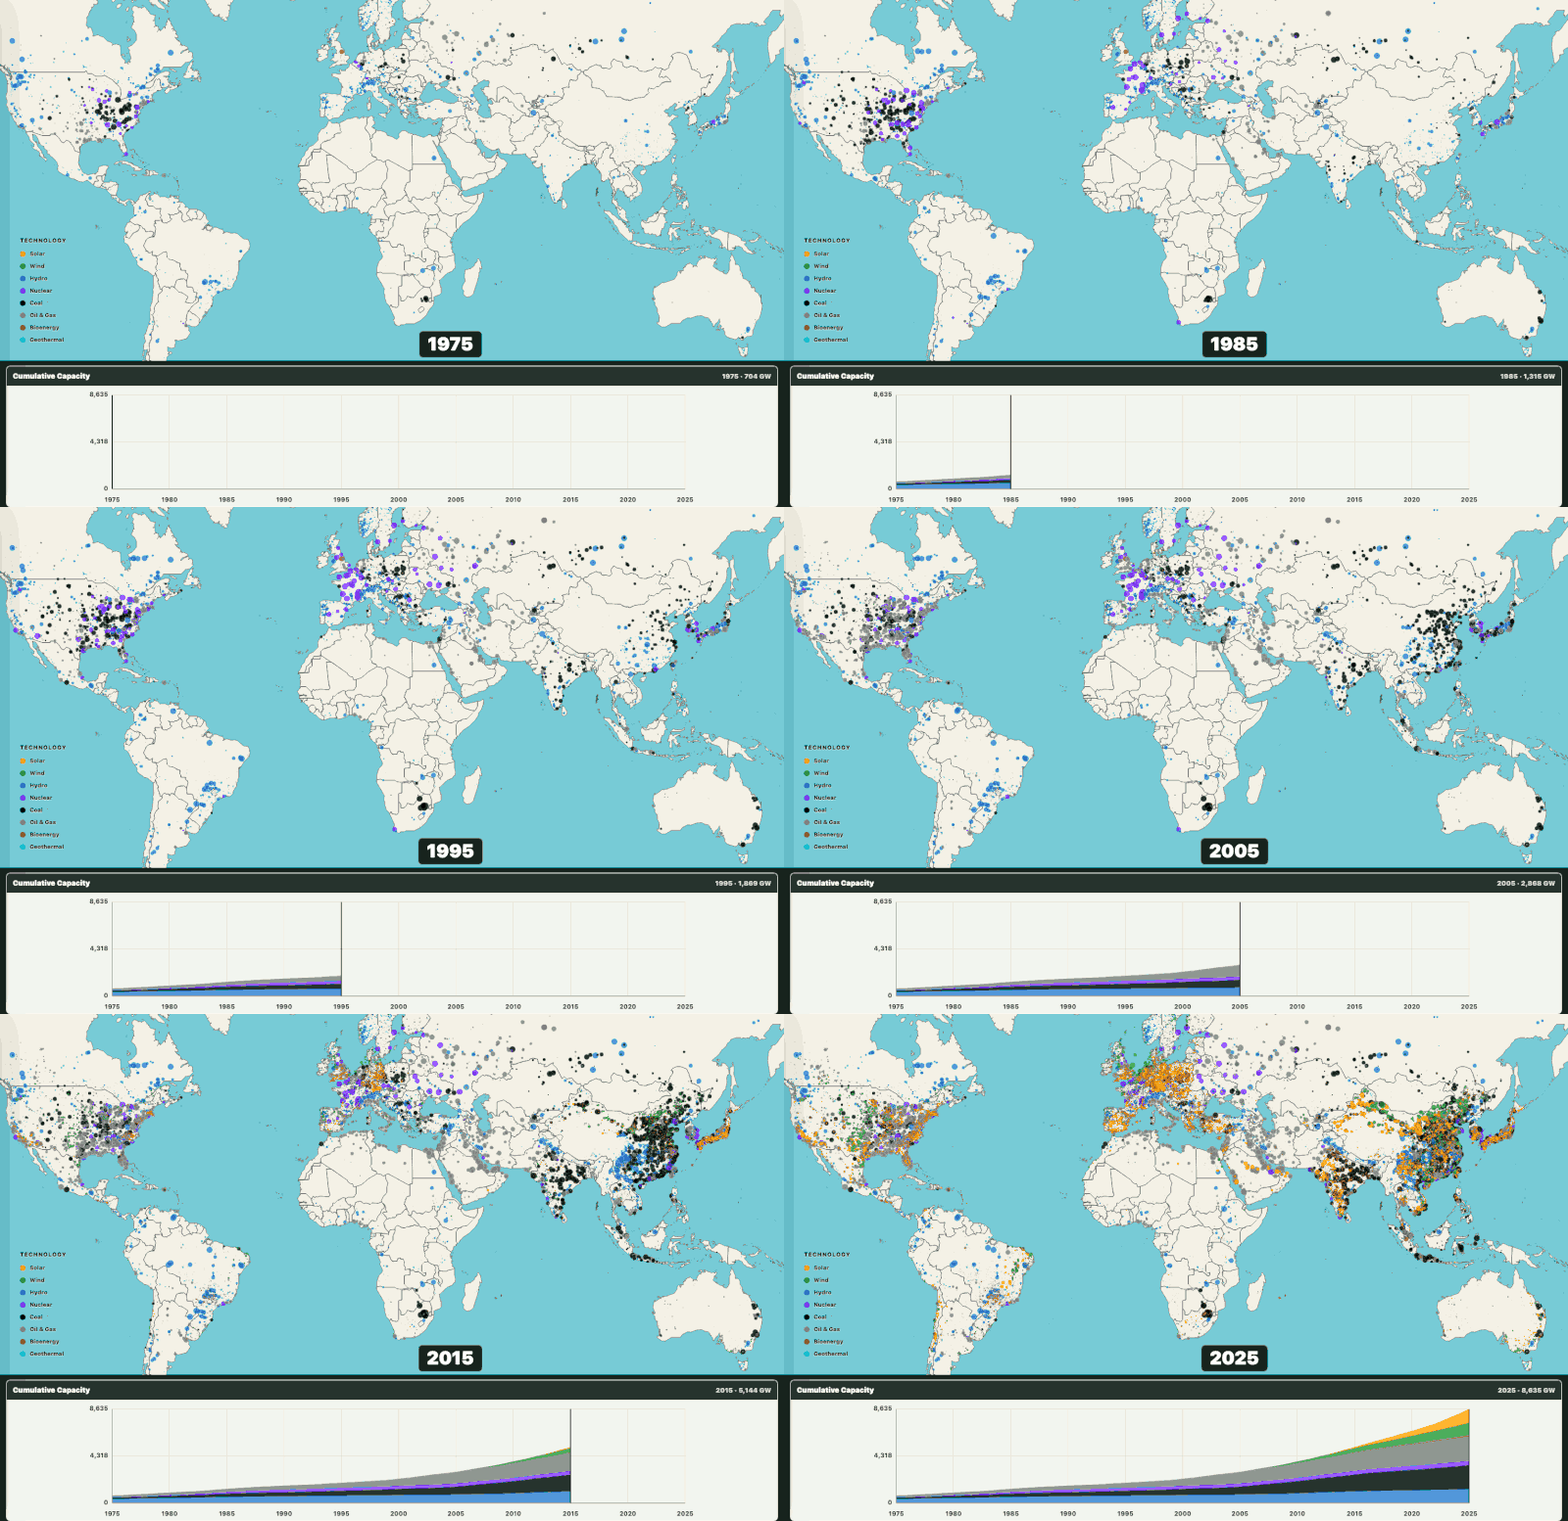
50 years of global power. By 2025, the world had ~9,000 GW of installed power capacity. In 1975, we had ~700 GW. This is more than 12x growth. The story of how we got here is incredible !!

Read the original postClose original post
50 years of global power.

By 2025, the world had ~9,000 GW of installed power capacity. In 1975, we had ~700 GW. This is more than 12x growth. The story of how we got here is incredible !!

The map shows every power plant in the world and when it was installed. Color denotes technology, size of the bubble denotes plant capacity.

Era 1: The Nuclear Surge (1975–1990) The world was building nuclear at a pace unimaginable today — peaking at ~35 GW in a single year.

Era 2: The Fossil Fuel Buildout (1995–2020) Two simultaneous booms. China's coal machine: >1,000 GW built in 25 years. The US natural gas surge: ~400 GW. In total, the world added ~3,000 GW of coal and gas/oil in just 25 years.

Era 3: The Solar & Wind Takeover (2015–present) Solar and wind annual additions climbed from ~100 GW in 2015 to >600 GW/yr in 2025 (incl. DRE), while costs fell by 80%.

The 50% Milestone
Here's one that surprises people. Clean energy (non-fossil — including hydro and nuclear) has crossed 50% of global installed capacity right now. >4,500 GW of non-fossil capacity. A transition that looked impossible in 2010 is now the dominant investment story of global power.

The Regional Stories
🇪🇺 Europe adopted RE years before anyone else — watch Germany and Spain light up solar and nordic countries and UK offshore wind starting late-2000s.
🇯🇵 Japan — post-Fukushima (2011), a remarkable solar response: 3–4 GW/year for five straight years, then largely stalled. A cautionary tale about what happens without sustained policy.
🇨🇳 China so dominates modern RE that it almost distorts the global picture: >1,500 GW of RE cumulative, and still accelerating.
🇮🇳 India and 🇧🇷 Brazil are catching up fast — India added ~40–50 GW of RE in 2025 alone.
🇺🇸 The US — steady, consistent, unglamorous. Still adding renewable capacity, held back mainly by long interconnection queues.

The Glaring Absences
Mexico. Indonesia. And most starkly — Africa.
Africa has ~130 GW of expensive gas and oil capacity (look along the coastlines) and just 16 GW solar + 11 GW wind — despite having some of the world's best solar irradiation, fastest-growing population, and largest energy access deficit. This is not a technology problem. It is a financing and policy problem.

Yes, the challenges are real — transmission, intermittency, storage, curtailment. The grid of the future won't build itself. But pause. We built ~2,500 GW of clean power in the last 10 years alone. Look at what's possible when economics, policy, and technology align. ⚡

NOTE: Chart excludes DRE and therefore understates the full ~9 TW of global capacity.

Amol Phadke Umed Paliwal Ashish Khanna Fatih Birol India Energy & Climate Center (IECC) Gauri Singh Karan Mangotra International Energy Agency (IEA) International Renewable Energy Agency (IRENA) International Solar Alliance
Global Energy Monitor
#energytransition
View post & discussion on LinkedIn ↗
Comparison of high-voltage transmission expansion in India and the United States from 2014 to 2026.
Original animation · open image to enlarge

A tale of two grids: India and the United States

⚡🌐 A Tale of Two Grids: How India added 10X more transmission capacity than the United States in the last decade (better animation in comments)

Read the original postClose original post
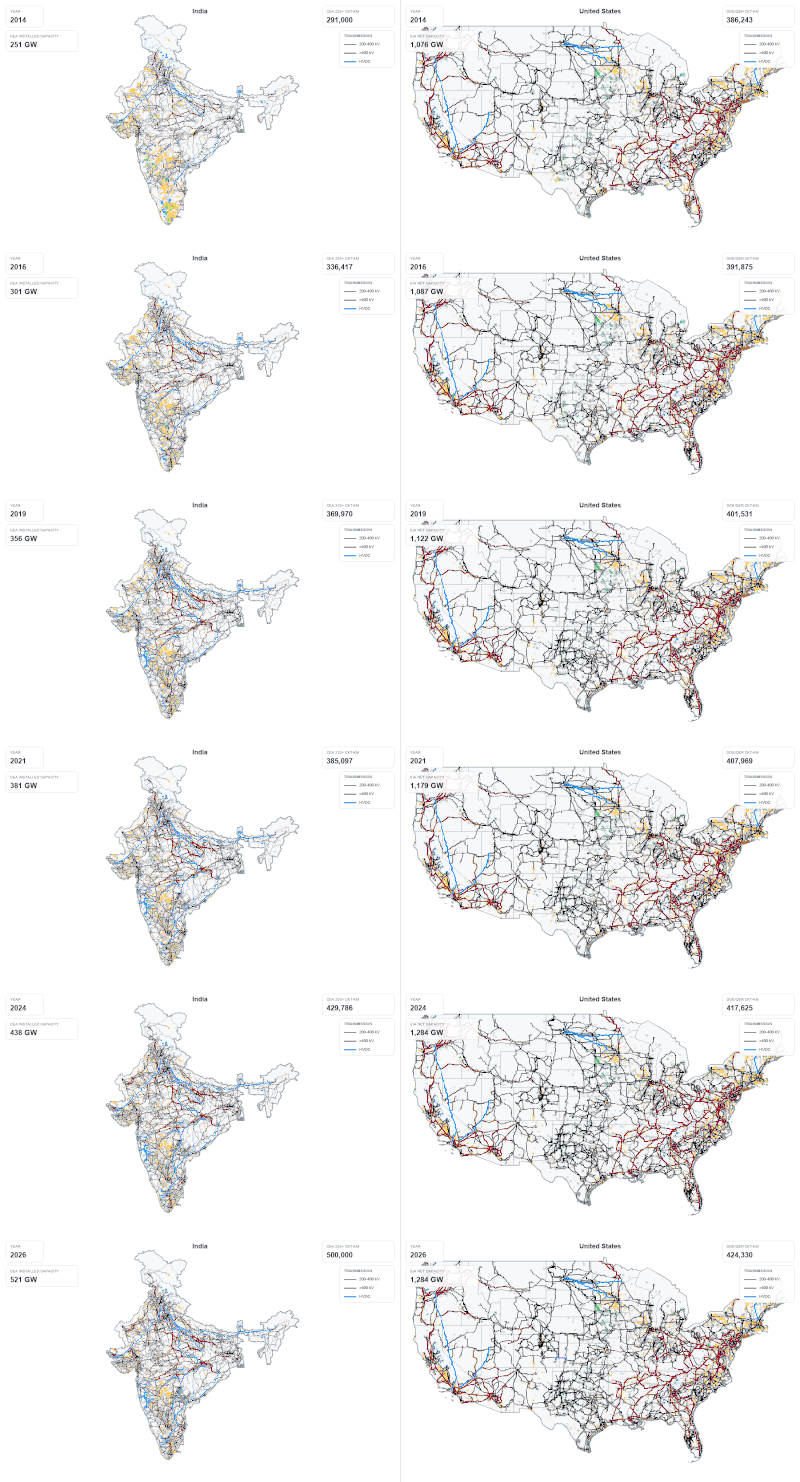
⚡🌐 A Tale of Two Grids: How India added 10X more transmission capacity than the United States in the last decade

(better animation in comments)

The clean energy transition is often told through renewable energy installations. But the quiet hero is transmission. No transition without transmission :)

This animation compares the growth of high-voltage transmission infrastructure mapped across India and the United States from 2014 to 2026.

What stands out is not just where the grids are dense today, but where new capacity appears over time.

Just in the last 12 years, India has added over 10 times high voltage transmission capacity compared to that in the US ! India's high voltage grid expanded by over 70% (>300,000 ckt km), while US expanded by about 10% (~35,000 ckt km).

India’s grid expansion has been rapid and visibly strategic, connecting renewable-rich regions, load centers, and large generation hubs. The U.S. grid, by contrast, remains vast but comparatively slow-moving, with new long-distance transmission additions much harder to see at this scale.

This matters because the next phase of clean energy deployment is about building the network that lets clean electricity flow, and building clean electricity where network exists.

Key caveats:
This uses OSM geospatial reconstruction, not official commissioning records. The numbers are indicative and not exact. But the directional picture is clear.
The goal was to build a visual way to ask: where is the grid actually expanding, and is it expanding fast enough? And the comparison is revealing.

(better animation in comments)

Amol Phadke Umed Paliwal Paritosh Jaiswal Mohit Bhargava Jose L. Dominguez B. Emilia Chojkiewicz India Energy & Climate Center (IECC) Anand R Gopal Power Grid Corporation Of India Limited (Powergrid) Soonee Sushil Kumar Narasimhan S.R. Rahul Tongia Ministry of Power Govt of India
View post & discussion on LinkedIn ↗
Breakdown of battery storage capital costs in India, comparing auctions from 2021 to 2026.
Original chart · open image to enlarge

India’s battery storage costs fall below $100/kWh

India Battery Cost Update: 2026 Battery Energy Storage System (BESS) capital cost has plunged to under $100/kWh (Rs 0.9 Cr/MWh or Rs 1.8 Cr/MW) in India - amongst the lowest in the world!!

Read the original postClose original post
India Battery Cost Update: 2026

Battery Energy Storage System (BESS) capital cost has plunged to under $100/kWh (Rs 0.9 Cr/MWh or Rs 1.8 Cr/MW) in India - amongst the lowest in the world!!

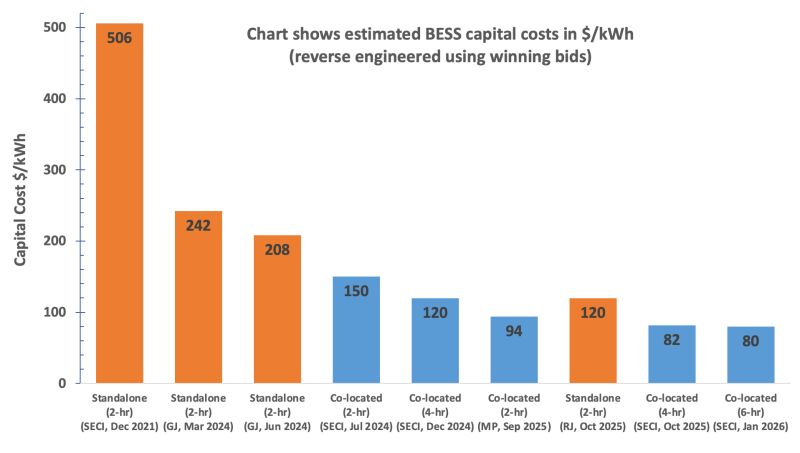
India has witnessed more than 80% reduction in battery storage capital costs since 2021. The latest SECI solar + storage auction results are a testament to this trend, with prices hitting a low of Rs 3.12/kWh for solar + 6-hours of storage.

Here is an attempt to estimate battery storage capex in India for the last 5 years:
2021 (SECI): Standalone storage at $500/kWh (Rs 8.0 Cr/MW).
2024 (GUVNL): Standalone storage at $200/kWh (Rs 3.5 Cr/MW).
2024 (SECI): Co-located storage at $150/kWh (Rs 2.5 Cr/MW).
2025 (MP) : Co-located storage at $95/kWh (Rs 2 Cr/MW).
2026 (SECI): Co-located storage at $85/kWh (Rs 1.8 Cr/MW).

In under five years, the BESS capital cost has plummeted by over 80%.

Indian developers are routinely accessing battery packs at $60/kWh or so, aligned with global market trends. The Balance of System (BOS) costs are $30-50/kWh depending on the system configuration (such as duration, co-located vs standalone, single vs double cycling etc) - implying total project capital cost of under ~$100/kWh.

Auctions have also clearly shown that co-located BESS is about 15-20% cheaper than standalone systems because of the saving in BOS costs.

Although we have seen a small cost increase in recent months (attributed to the supply chain constraints due to the war), in general, given the global manufacturing overcapacity, we anticipate battery pack prices to drop further, potentially reaching $50/kWh by 2030, implying a BESS capital cost of $80-90/kWh.

We are entering a new era of power sector planning, necessitating a fresh look at all our least-cost resource assessments for meeting the growing electricity demand.

#EnergyStorage #RenewableEnergy #PowerSector #BatteryRevolution
Amol Phadke Umed Paliwal India Energy & Climate Center (IECC) Ministry of New and Renewable Energy (MNRE) Solar Energy Corporation of India Limited Gujarat Urja Vikas Nigam Ltd. (GUVNL) Manu Srivastava Jai Prakash Shivahare, IAS Ashwin Gambhir Debmalya Sen India Energy Storage Alliance (IESA) Dr. Rahul Walawalkar
View post & discussion on LinkedIn ↗
Original Indian Express opinion article image accompanying the post on demand for low-cost clean power.
Original article image · open image to enlarge

Who will buy India’s cheapest clean power?

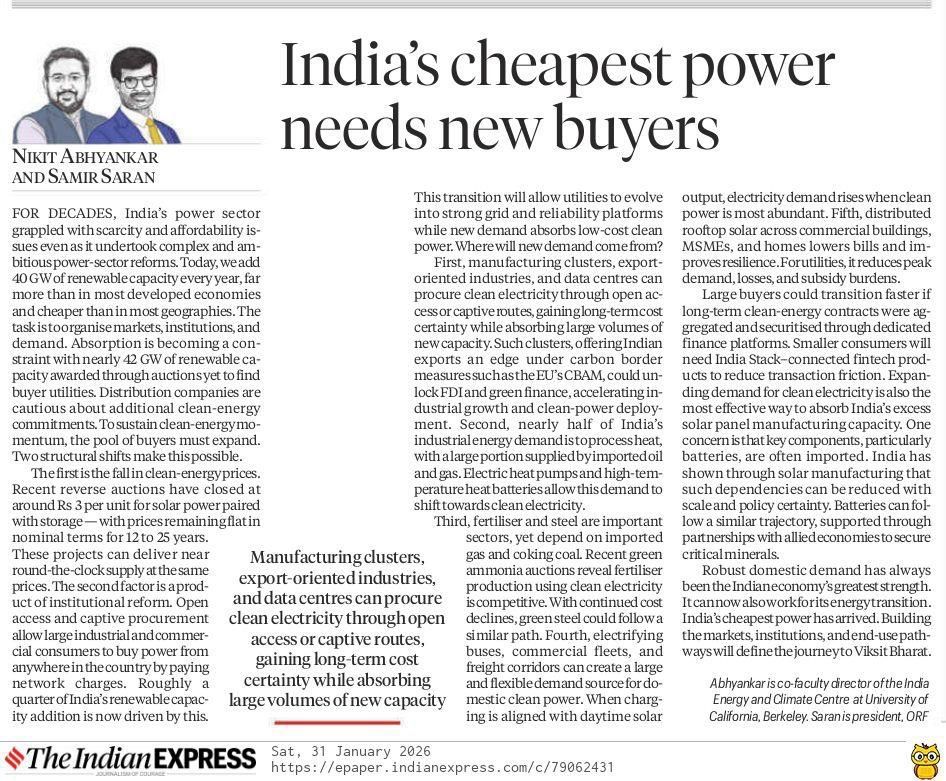
India’s cheapest power has arrived. The real question is: who will buy it? In The Indian Express, Samir Saran and I argue that recent solar + storage bids, delivering power at ~Rs 3/kWh flat for 25 years, have effectively shifted the clean energy bottleneck from supply to demand.

Read the original postClose original post
India’s cheapest power has arrived. The real question is: who will buy it?

In The Indian Express, Samir Saran and I argue that recent solar + storage bids, delivering power at ~Rs 3/kWh flat for 25 years, have effectively shifted the clean energy bottleneck from supply to demand.

The market is willing to supply clean firm power around Rs 3-4/kWh. We need new buyers beyond utilities to procure this power.

India’s position is truly unique: low-cost clean electricity, a large integrated national grid, and a robust open access and captive procurement framework that allows large consumers to contract power directly. Few major economies combine all three.

For a country with export ambitions and rising industrial demand, this is strategic. Manufacturing clusters, export-oriented industries, data centres, green steel, and electrified mobility can provide long term anchors for clean energy.

If institutions, market design, and industrial policy align around this shift, cheap clean power could become one of India’s most powerful competitive advantages of the decade.

Observer Research Foundation India Energy & Climate Center (IECC)
View post & discussion on LinkedIn ↗
Hourly solar and battery dispatch for peaking and near-baseload clean electricity configurations.
Original chart · open image to enlarge

From peaking power to near-baseload clean supply

Near-baseload (24x7) clean power in India could be available under Rs 3.5/kWh ($38/MWh) !! SECI's recent Solar + 6-hr storage (ISTS-XXI) is turning point for clean firm power in India.

Read the original postClose original post
Near-baseload (24x7) clean power in India could be available under Rs 3.5/kWh ($38/MWh) !!

SECI's recent Solar + 6-hr storage (ISTS-XXI) is turning point for clean firm power in India.

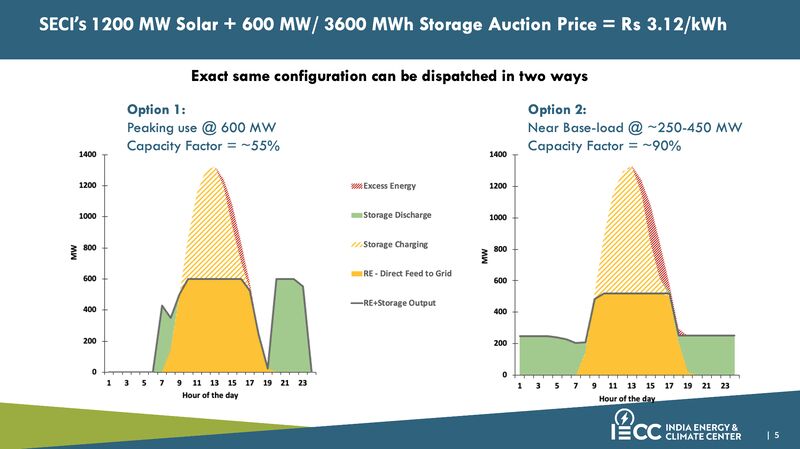
Configuration: 1,200 MW of solar PV + 600 MW / 3,600 MWh energy storage (6-hour BESS)
L1 Tariff Discovered: ₹3.12 - ₹3.13/kWh) — flat in nominal terms for 25 years.

This auction is not just about peaking power. It establishes a new benchmark for near-baseload 24×7 clean supply.

The attached graphic shows two ways the exact same system can be dispatched (based on an annual hourly simulation for a Rajasthan solar profile):

☀️ Option 1: Peaker (as currently structured)
• 600 MW discharge
• 6-hour assured peak supply
• Covers evening + morning peak hours
Designed for peak management.

⚡ Option 2: Near-Baseload (24×7 profile)
The same assets can instead be dispatched as:
• ~450 MW flat during solar hours (9am–5pm)
• ~250 MW flat during non-solar hours (6pm–8am)
• 80-90% annual capacity factor (depending on the AC basis)

This effectively converts solar + storage into a high capacity factor, firm renewable supply resource at the same price !!

Of course I am ignoring the slightly higher(~5%) curtailment due to baseload operation, which could increase the costs at most by 5% assuming curtailed energy could not be sold anywhere.

That’s a massive leap toward 24×7 renewable dispatchability at highly competitive costs.

More importantly this power is inflation-proof.

Amol Phadke Manu Srivastava Umed Paliwal Shruti Mahajan Deorah Neelima Jain Paritosh Jaiswal Pratik Prasun Solar Energy Corporation of India Limited Debmalya Sen Dr. Rahul Walawalkar India Energy & Climate Center (IECC) Soonee Sushil Kumar Abhishek Ranjan Mohit Bhargava
#SolarPlusStorage #EnergyTransition #CleanEnergy #IndiaSolar #BESS #SECI #Renewables #GridFlexibility
View post & discussion on LinkedIn ↗
Original animation · plays automatically, muted

India’s renewable energy transition, state by state

Where do Indian states stand in the renewable energy transition? This animated chart highlights the top 10 states in renewable energy installed capacity over the past decade.

Read the original postClose original post
Where do Indian states stand in the renewable energy transition?
This animated chart highlights the top 10 states in renewable energy installed capacity over the past decade.

In the early years—until around 2015—the sector was led predominantly by wind-rich states like Tamil Nadu and Maharashtra, along with legacy hydro (e.g. states like Himachal Pradesh). But the landscape changed rapidly with the rise of solar.
Notice the sharp rise in Karnataka until 2018/2019 or so.
Post-2020, Gujarat and Rajasthan emerged as dominant solar leaders, accelerating their clean energy build-out at an unprecedented pace.
India’s total renewable energy capacity has nearly tripled—from ~80 GW in 2015 to ~220 GW by March 2025. And this is just the beginning !

🎥 Watch the energy transition unfold in this short video.

#RenewableEnergy #IndiaEnergy #EnergyTransition #SolarPower #WindEnergy #CleanEnergy #Gujarat #Rajasthan #TamilNadu #Karnataka #Maharashtra #EnergyPolicy #EnergyStorage
Amol Phadke Shruti Mahajan Deorah Neelima Jain Umed Paliwal Ashwin Gambhir Alok Kumar Jai Prakash Shivahare, IAS Manu Srivastava India Energy & Climate Center (IECC) GERMI (Gujarat Energy Research and Management Institute) Gujarat Urja Vikas Nigam Ltd. (GUVNL)
View post & discussion on LinkedIn ↗
January and April demand and net-demand curves for India, showing actual and projected evening ramps.
Original chart · open image to enlarge

India’s deepening duck curves

India’s Deepening Duck Curves Highlight Urgent Need for Storage and Demand-Side Solutions The January and April duck curves below reveal India’s growing net demand gap: solar generation floods the grid during the afternoon, but demand surges again in the evening—just as solar fades. The chart shows average hourly demand (solid black lines) and net demand (demand minus variable renewables, in colored lines) from 2019 to 2027 (actuals through 2025; projections for 2026–2027). By 2025, India had become energy sufficient across the day, but increasingly peak deficient. Key insights: ✅ Surplus solar during midday ⚠️ Steep evening ramps stressing thermal generators 🔥 ~50 GW higher nighttime demand in April vs January—likely due to cooling loads This growing mismatch creates operational challenges for thermal power plants and raises the risk of evening shortfalls, especially during hot months. Energy storage is now essential—to shift solar generation from afternoon to evening and maintain grid reliability. Just as important are demand-side strategies, including energy-efficient cooling, time-of-day pricing, and demand response programs. These can help flatten the curve, reduce system costs, and enhance reliability. India’s duck curve is no longer a future—it’s already here. Now is the time to act. #DuckCurve #EnergyStorage #IndiaEnergyTransition #CoolingDemand #GridFlexibility #Renewables #EnergyEfficiency #DemandResponse #EnergySecurity Amol Phadke Shruti Mahajan Deorah Neelima Jain Umed Paliwal Soonee Sushil Kumar Narasimhan S.R. Samir Chandra Saxena India Energy & Climate Center (IECC) Ministry of New and Renewable Energy (MNRE) Grid Controller of India Limited

Read the original postClose original post
India’s Deepening Duck Curves Highlight Urgent Need for Storage and Demand-Side Solutions
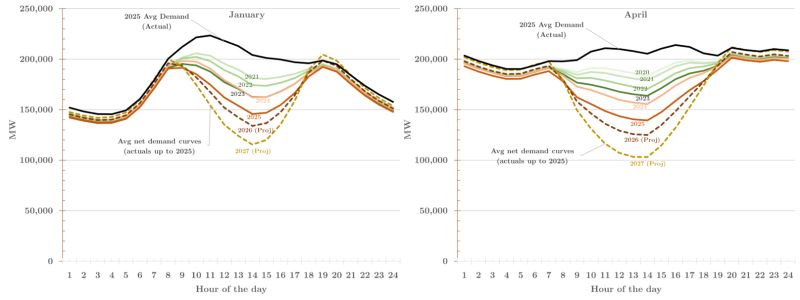
The January and April duck curves below reveal India’s growing net demand gap: solar generation floods the grid during the afternoon, but demand surges again in the evening—just as solar fades. The chart shows average hourly demand (solid black lines) and net demand (demand minus variable renewables, in colored lines) from 2019 to 2027 (actuals through 2025; projections for 2026–2027).
By 2025, India had become energy sufficient across the day, but increasingly peak deficient.
Key insights:
✅ Surplus solar during midday
⚠️ Steep evening ramps stressing thermal generators
🔥 ~50 GW higher nighttime demand in April vs January—likely due to cooling loads
This growing mismatch creates operational challenges for thermal power plants and raises the risk of evening shortfalls, especially during hot months.
Energy storage is now essential—to shift solar generation from afternoon to evening and maintain grid reliability.
Just as important are demand-side strategies, including energy-efficient cooling, time-of-day pricing, and demand response programs. These can help flatten the curve, reduce system costs, and enhance reliability.
India’s duck curve is no longer a future—it’s already here. Now is the time to act.
#DuckCurve #EnergyStorage #IndiaEnergyTransition #CoolingDemand #GridFlexibility #Renewables #EnergyEfficiency #DemandResponse #EnergySecurity
Amol Phadke Shruti Mahajan Deorah Neelima Jain Umed Paliwal Soonee Sushil Kumar Narasimhan S.R. Samir Chandra Saxena India Energy & Climate Center (IECC) Ministry of New and Renewable Energy (MNRE) Grid Controller of India Limited
View post & discussion on LinkedIn ↗
Projected air-conditioning electricity demand and potential savings from stronger efficiency standards in India.
Original chart · open image to enlarge

Making efficient cooling a national priority

🔌 **Air Conditioner Efficiency Must Be a National Priority for India** As India braces for another record-breaking summer, our new study shows that doubling the efficiency of room air conditioners (ACs) could spell the difference between a reliable grid and severe blackouts.

Read the original postClose original post
🔌 **Air Conditioner Efficiency Must Be a National Priority for India**

As India braces for another record-breaking summer, our new study shows that doubling the efficiency of room air conditioners (ACs) could spell the difference between a reliable grid and severe blackouts.

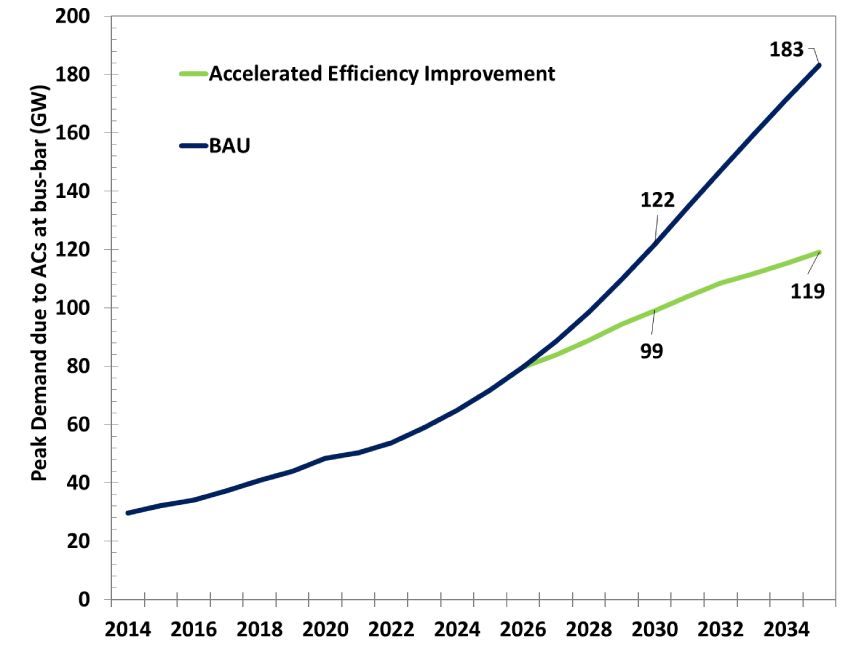
🇮🇳 India adds 10–15 million new ACs each year, with another 130–150 million expected over the next decade. Without stronger efficiency standards, room ACs alone could drive 120 GW of peak demand by 2030 and 180 GW by 2035—nearly 30% of the projected national total.

To put it in perspective: Peak load of the entire nation of Japan is ~160-170 GW.

📊 What We Recommend
Progressively tightening the AC minimum efficiency standard:
• 2027: Indian Seasonal Energy Efficiency Ratio or ISEER 5.0 (today’s 5-star level)
• 2030: ISEER 6.3 (India’s current best)
• 2033: ISEER 7.4 (on par with the global best)

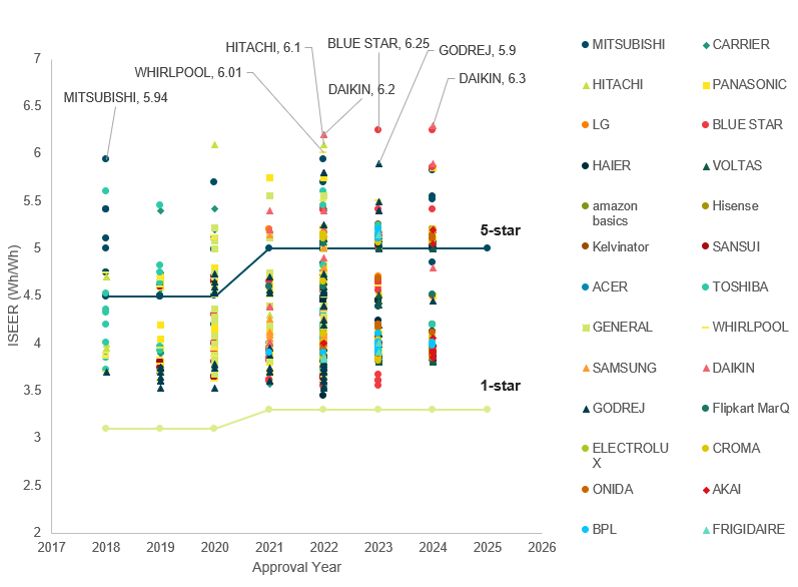
This roadmap reflects what’s already commercially available. Over 600 models (20% of the market) exceed today’s 5-star level, and top domestic and international manufacturers are offering ISEER 6.0+ models at competitive prices. The supply chain appears ready to scale.

✅ The Opportunity
• Avoid 10 GW of peak demand by 2028, 23 GW by 2030, and 60 GW by 2035—equal to 120 large power plants !
• Save ₹7.5 trillion ($85B) in avoided generation and grid infrastructure
• Deliver ₹2.2 trillion ($26B) in net consumer savings, even after considering higher price of efficient ACs.

💡 Efficient Cooling = Affordable Cooling
Globally and in India, efficiency upgrades often coincide with lower AC prices, thanks to economies of scale and streamlined supply chains. Our analysis shows that energy efficiency is not the main driver of AC costs. Several no-frills high-efficiency models are available at prices similar to low-efficiency models.

🧩 What Else Is Needed?
• Update test procedures to reflect India’s humid climate
• Scale adoption through bulk procurement, GST waivers, and PLI incentives
• Expand access to super-efficient ACs for every household

⚠️ The Cost of Inaction
Weak or delayed efficiency standard revisions risk locking India into decades of inefficient cooling technologies, worsening power shortages, and driving costly grid expansion.

With urban AC ownership still at just 10% and rising fast, the decisions we make today will shape India’s energy and economic future.

🔗 Read the full report: https://lnkd.in/gq3KVmhB

Nihar Shah Amol Phadke Neelima Jain Jose L. Dominguez B. Shruti Mahajan Deorah India Energy & Climate Center (IECC)
Bureau of Energy Efficiency (ऊर्जा दक्षता ब्यूरो) Bureau of Energy Efficiency Ministry of Power Govt of India Piyush Goyal Manohar Lal
Satish Kumar Ankit Kalanki CLASP Mehul Jain Aditya Chunekar Godrej Consumer Products Limited Daikin Airconditioning India Pvt. Ltd.
#EnergyEfficiency #CoolingIndia #PowerShortages #ClimateResilience #CleanEnergy #NetZero #MakeInIndia #IECC #Berkeley
View post & discussion on LinkedIn ↗
Indian room air-conditioner models by efficiency, showing models exceeding the current five-star standard.
Original chart · open image to enlarge

India’s air-conditioner market is ready for higher standards

India’s Room AC Market is Ready for Transformation! 🔥❄️ 🚀 Efficiency Labels Are Outdated India’s air conditioning sector is on the brink of a major shift. With 600 models already significantly surpassing 5-star efficiency standards, the market is proving that higher efficiency is not just possible—it’s already here! It's time for the star-labels to catch up !

Read the original postClose original post
India’s Room AC Market is Ready for Transformation! 🔥❄️

🚀 Efficiency Labels Are Outdated
India’s air conditioning sector is on the brink of a major shift. With 600 models already significantly surpassing 5-star efficiency standards, the market is proving that higher efficiency is not just possible—it’s already here! It's time for the star-labels to catch up !

💰 Efficiency ≠ Higher Prices
A persistent myth is that stricter efficiency standards would increase AC prices and reduce affordability. Yet, global and Indian market data show otherwise—as efficiency improves, costs often decline due to economies of scale, improved manufacturing, and market competition.

💡 Domestic Brands Are Ready
A common concern is that raising AC efficiency would require new supply chains or technology gaps for domestic manufacturers. However, companies like Godrej and Blue Star are already producing super-efficient ACs, proving that Indian manufacturers are fully capable of scaling high-efficiency models.


📊 The Chart Speaks for Itself!
Our analysis visualizes India’s room AC efficiency landscape, with data from the BEE website showcasing how most ACs already exceed current label requirements. Each plotted point represents a variable speed AC unit offered for sale in India in 2024, with colors denoting manufacturers and the Y-axis reflecting AC efficiency in ISEER. Efficiency level for each unit is taken from its label as reported on the BEE website. The lines show 1-star and 5-star efficiency labels for room ACs from 2018 to 2025 as specified by BEE.

The future is clear: India is ready for the next level of efficiency!

🔎 Time to modernize AC efficiency standards! What are your thoughts on accelerating India’s energy efficiency transition? Let’s discuss in the comments! 👇🏽💬 #EnergyEfficiency #India #SustainableCooling #AirConditioning
Nihar Shah Amol Phadke Bureau of Energy Efficiency (ऊर्जा दक्षता ब्यूरो) CLASP Satish Kumar Piyush Goyal Aditya Chunekar Amit Khare Jose L. Dominguez B. Mehul J. Neelima Jain Soumya Garnaik Saurabh Kumar Saurabh Diddi Sameer Kwatra
View post & discussion on LinkedIn ↗
Assessment of India’s projected peak demand, supply capacity, and evening power shortages.
Original table · open image to enlarge

Closing India’s evening power gap

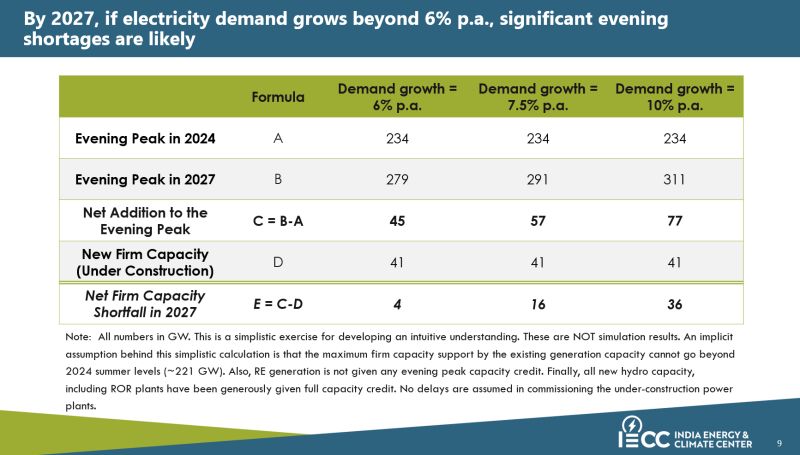
🚨 Urgent Alert: India could face an evening/nighttime power shortage of 20-30 GW (8-12%) in the next 2-3 years! 🔍 Why?   India's evening/night peak demand is set to surge by 50-80 GW by 2027. Peak demand soared by 46 GW in just two years, from 204 GW in May 2022 to 250 GW in May 2024. While 41 GW of thermal and hydro capacity is under construction, peak demand growth will outpace this addition. Delays or heat waves could worsen the shortages.

Read the original postClose original post
🚨 Urgent Alert: India could face an evening/nighttime power shortage of 20-30 GW (8-12%) in the next 2-3 years!

🔍 Why?  
India's evening/night peak demand is set to surge by 50-80 GW by 2027.
Peak demand soared by 46 GW in just two years, from 204 GW in May 2022 to 250 GW in May 2024.
While 41 GW of thermal and hydro capacity is under construction, peak demand growth will outpace this addition. Delays or heat waves could worsen the shortages.

🌞 Will Renewable Energy (RE) Help?
Summer evening peaks see minimal solar generation and uncertain wind output.
In May 2024, only 8-10 GW of RE was available during evening peaks, despite over 140 GW installed capacity (excluding large hydro).
Adding ~100 GW of new RE in the next 3 years won't sufficiently address evening/nighttime shortages.

💡 What's the Solution? 
Large-Scale Solar + Storage: This is the fastest deployable option.
By 2027, adding 100-120 GW of new solar, with 50-100 GW co-located with 16-30 GW x 4-6 hours of storage, can prevent shortages.
Recent solar + storage auctions hit record low prices of Rs 3.4/kWh, highlighting the economic viability.
Policy & Regulatory Support: Crucial for boosting investments in storage and ensuring long-term energy stability.

📈 Investments in storage, as projected by the CEA and our studies, will be vital for India's energy future. Let's act now to secure a reliable and sustainable power supply for the years ahead! 🌟🔋⚡

#EnergyIndia #SolarStorage #RenewableEnergy #IndiaPower #SustainableFuture

Read more in our new study: https://lnkd.in/gQxEyV3Y
Amol Phadke Tarannum Sahar Umed Paliwal India Energy & Climate Center(IECC) Sushanta Chatterjee Ashwin Gambhir Soonee Sushil Kumar Dinesh Jagdale Solar Energy Corporation of India Limited Jai Prakash Shivahare, IAS Neelima Jain Shruti Mahajan Deorah. Climate Trends Aarti Khosla
View post & discussion on LinkedIn ↗
Breakdown of battery storage capital costs in India from 2021 to 2024.
Original chart · open image to enlarge

The falling cost of battery storage

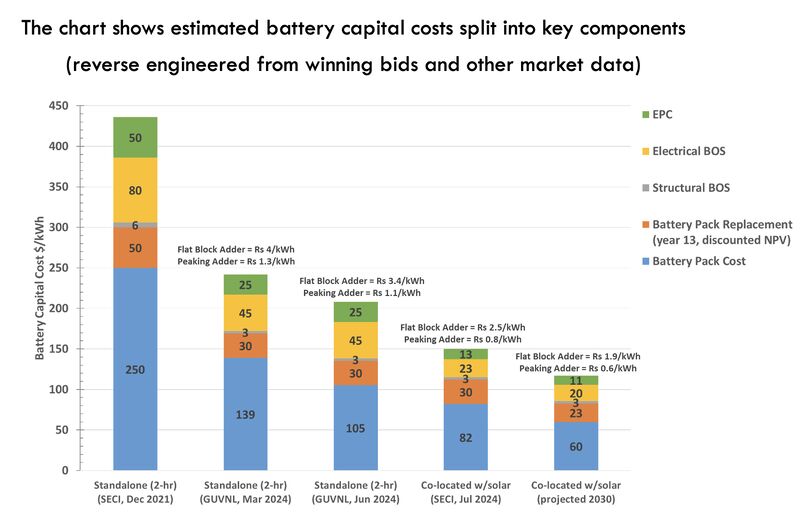
BESS capital cost has plunged to $150/kWh (Rs 2.5 Cr/MW) in India !! India has witnessed a remarkable plunge in battery storage prices since 2021. The latest SECI solar + storage auction results are a testament to this trend, with prices hitting a low of Rs 3.41/kWh.

Read the original postClose original post
BESS capital cost has plunged to $150/kWh (Rs 2.5 Cr/MW) in India !!

India has witnessed a remarkable plunge in battery storage prices since 2021. The latest SECI solar + storage auction results are a testament to this trend, with prices hitting a low of Rs 3.41/kWh.

The key question is what BESS capital cost makes these prices possible ?

Here is an attempt to estimate battery storage capex in India for the last 3 years:
2021 (SECI): Standalone storage at $450/kWh (Rs 7.5 Cr/MW).
2024 (GUVNL): Standalone storage at $200/kWh (Rs 3.2 Cr/MW).
2024 (SECI): Co-located storage at $150/kWh (Rs 2.5 Cr/MW).

In just three years, the BESS capital cost has plummeted by nearly 70%.

Indian developers are accessing battery packs at $80-100/kWh, aligning with global market trends. LFP pack prices in China have fallen to $60-70/kWh.

With declining material costs and global manufacturing overcapacity, we anticipate battery pack prices to drop further, potentially reaching $50-60/kWh by 2030, implying a BESS capital cost of $100-120/kWh.

We are entering a new era of power sector planning, necessitating a fresh look at all our least-cost resource assessments for meeting the growing electricity demand.

#EnergyStorage #RenewableEnergy #PowerSector #BatteryRevolution
Amol Phadke Jai Prakash Shivahare, IAS Umed Paliwal Neelima Jain Shruti Mahajan Deorah Ashwin Gambhir. Debmalya Sen Dr. Rahul Walawalkar Dr.-Ing. Yashodhan Pramod Gokhale Dinesh Jagdale Sushanta Chatterjee Ministry of New and Renewable Energy (MNRE) India Energy & Climate Center(IECC)
Solar Energy Corporation of India Limited Gujarat Urja Vikas Nigam Ltd. (GUVNL)
View post & discussion on LinkedIn ↗
Hourly Indian Energy Exchange day-ahead electricity prices over three years.
Original chart · open image to enlarge

What electricity prices reveal about India’s grid

🚀💡 Exciting Insights from India's Electricity Market! 💡🚀 India's electricity market has evolved tremendously, and the wholesale energy prices serve as the vibrant pulse of the power system! 🌟 Let's dive into some fascinating revelations from the last three years' data on the Indian Energy Exchange day-ahead market clearing prices. 📊

Read the original postClose original post
🚀💡 Exciting Insights from India's Electricity Market! 💡🚀

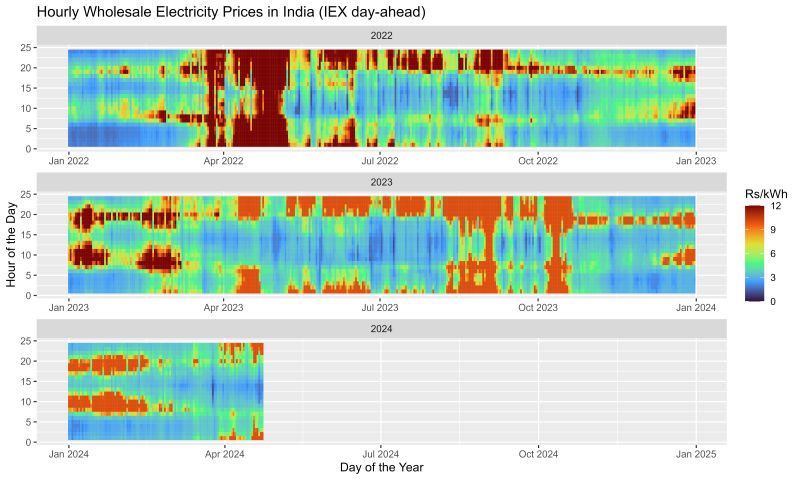
India's electricity market has evolved tremendously, and the wholesale energy prices serve as the vibrant pulse of the power system! 🌟 Let's dive into some fascinating revelations from the last three years' data on the Indian Energy Exchange day-ahead market clearing prices. 📊

1️⃣ The charts vividly showcase the dynamic nature of prices throughout the day, echoing the iconic duck curves! 🦆 With prices hitting rock bottom during solar generation hours, as system's marginal cost plunges, only to rise again at night. 🌞➡️🌚
2️⃣ Night-time prices consistently surpass Rs 8-10/kWh, hinting that they're not solely reliant on baseload coal power plants. 🌃 They also indicate when additional energy generation would be most valuable.💡
3️⃣ Value of energy storage 🚀⚡️ With 4-6 hours of sustained high energy prices, the potential for price arbitrage is high! 📈 But let's not jump the gun; as demand evolves and renewables surge, the game is ever-changing! 🔄
4️⃣ Any reduction in night load, be it through AC demand response or bolstered energy efficiency, packs a punch in value! 💰💡 Much higher than demand reductions during solar hours.

The charts also clearly show the crazy heatwaves of April-May of 2022 with record breaking electricity demand and prices >Rs 10/kWh for 24x7!

How to read these charts?
X-axis is the day of the year (365 days from Jan 1 through Dec 31) and the Y-Axis is the hour of the day (1 to 24). Color of each grid point shows the electricity price, which changes every 15-minutes. Blue is low price, red is high price, as shown on the color scale.

Amol Phadke Shruti Mahajan Deorah Neelima Jain Umed Paliwal India Energy & Climate Center(IECC) Indian Energy Exchange (IEX) Rajesh K Mediratta Soonee Sushil Kumar
View post & discussion on LinkedIn ↗

See all posts on LinkedIn ↗

Read published opinion pieces